
Rent a Car
Module 02 · BI
The car rental market
history, since 2016
Understand what has changed, why, and where your market is heading.

Business Intelligence & Trends
A decade of history to understand where the market is heading
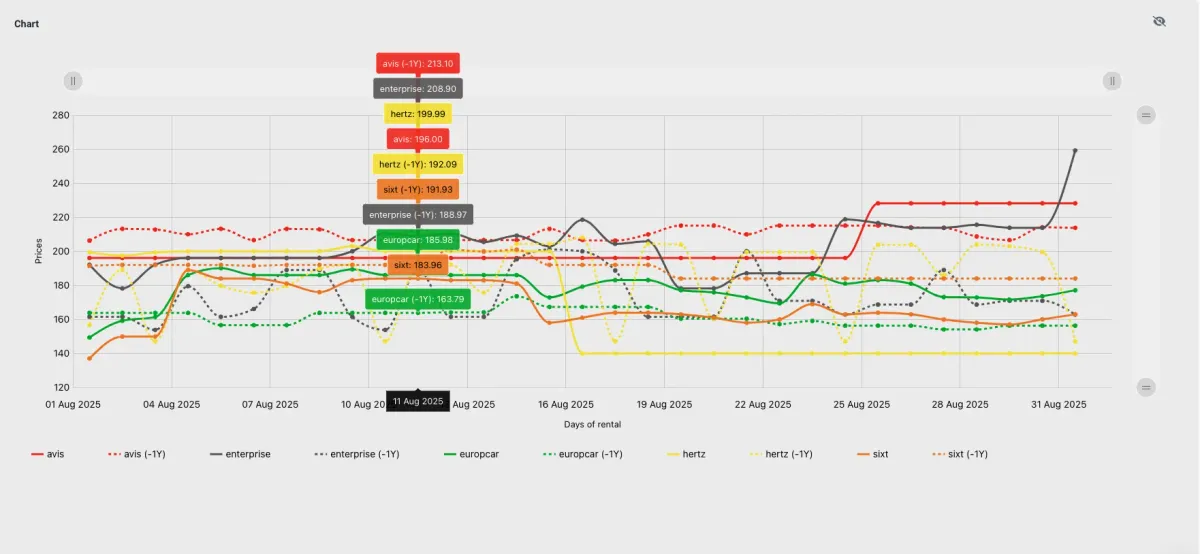
Complete historical record of the car rental market since 2016. Trends by market, location, category and season. Benchmarking against your direct competitors and detection of seasonal or structural patterns.
What's included
Business Intelligence & Trends, in detail
- Multi-year historical data on prices, ratings and availability
- Time-based analysis by market, location and category
- Continuous benchmarking vs direct competitors
- Detection of seasonal and structural patterns
- Shareable dashboards for your leadership team

Why it matters
What this module changes in your day-to-day
More than a decade of context
Every price movement makes more sense with the history in front of you: market data since 2016.
From change to trend
Seasonal and structural patterns detected by market, location and category, not just today’s price.
Indicators tailored to your business
Every car rental company has its own categories, markets and priorities. BI reads the history through the variables that really matter to your operations.
From data to trend
Not every price change means the same thing.
An increase can be a seasonal pattern, a competitor move or a specific opportunity. History lets you tell a one-off variation from a trend that calls for a decision.
Every car rental company works with different locations, categories, durations and KPIs. BI reads the history through the variables that really shape your operations.
-
When it changes
Spot patterns by season and date.
-
Where it changes
Compare locations, markets and categories.
-
Against whom
Understand your position against your direct competitors.
Pricing tells you what the price is today. BI helps you understand why it changed and whether that change deserves a decision.
Proprietary infrastructure
More than a decade capturing market data
Want to see it with your own data?
Within 48 hours we show you a real analysis of your market.
Keep exploring