
Retail · For Brands ·
Featured product · PHI
The full state of your product, in a single number
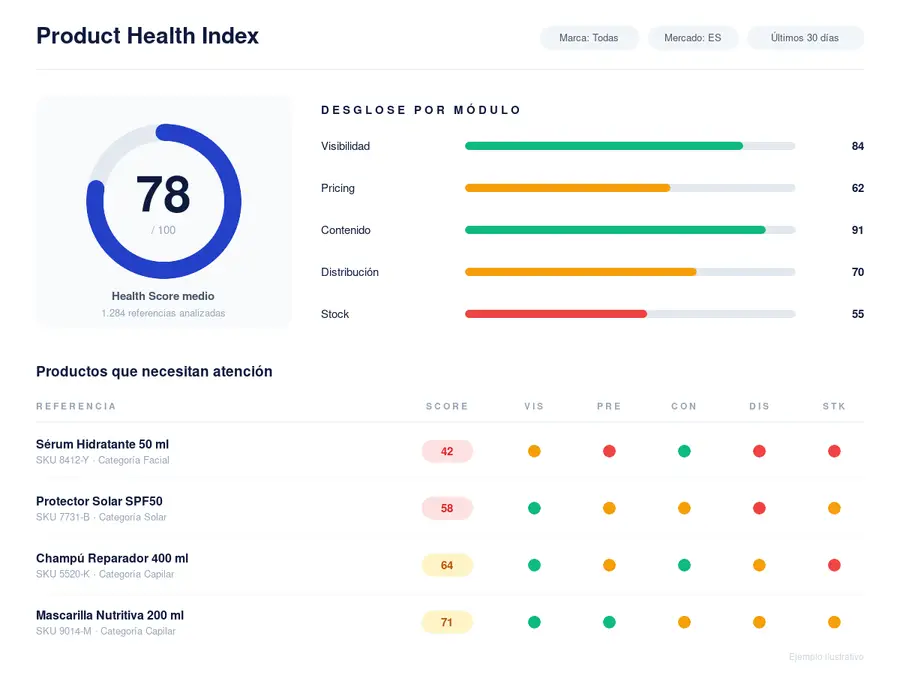
The modules synthesized into a single score per SKU: visibility, pricing, content, distribution and stock. Identify at a glance which products need attention and where the problems lie. Your control center for managing thousands of references.
What's included
Product Health Index, in detail
- A single score per SKU synthesizing the modules
- Visibility, pricing, content, sellers and stock in one view
- Immediate identification of the products that need attention
- Breakdown by dimension to locate the source of the problem
- Built to manage thousands of references without losing detail
What this module changes in your day-to-day
From thousands of SKUs to a short list
The PHI ranks your catalog by product health: your team starts the day knowing where to look.
From symptom to cause
Each score breaks down into its dimensions, visibility, price, content, distribution, stock, to reach the origin in two clicks.
One data point for everyone
Pricing, trade marketing and e-commerce work on a single data point, every day, as clients like Puig already do.
FAQs
Frequently asked questions about the Product Health Index
How is the Product Health Index generated?
Every day we capture, for each SKU, retailer and market, the signals of visibility, price, content, distribution and stock. The PHI combines them into a single score from 0 to 100 per product, weighting each dimension according to its impact on sales. A high score means the product is well represented in the channel; a low one, that something needs fixing.
Which modules feed the score?
The five DIP Insights modules for brands: Visibility (presence in banners, listings and search engines), Pricing (MSRP and MAP compliance), Content (product page quality), Distribution (authorised sellers and Buy Box) and Stock (public availability). The PHI does not generate new data: it summarises what those modules already produce.
If a product has a low score, does it show the cause?
Yes. When you open any product you see the breakdown by dimension and what is pulling the score down: a stock-out, a price below MAP, an incomplete product page, an unauthorised seller or a loss of visibility. From there you can drill down into the corresponding module to see the detail by retailer and market.
Can it work with thousands of SKUs?
It is built for that. Our infrastructure captures more than 20 million prices a day at more than 1,000 retailers in more than 50 countries, and the PHI is designed precisely so that a team does not have to review reference by reference: it sorts the whole catalogue by impact and shows you first the products that need attention.
Can the rules be configured to suit my business?
Yes. The weight of each dimension, the thresholds that flag a product as critical and the retailers, markets and categories included in the calculation are configured per brand. A launch, a strategic reference or a priority retailer can weigh more than the rest.
Does the PHI replace the other modules?
No. The PHI is the layer that brings them together and prioritises: it tells you where to look. The detail of each problem stays in its module (Visibility, Pricing, Content, Distribution or Stock), which is where each team drills down and acts. Usually management and product managers work from the PHI and each team goes down to its module.
Want to see it with your own data?
Within 48 hours we show you a real analysis of your market.
Keep exploring
Related modules
Module 01 · Visibility
Brand Visibility & Share of Voice
Measure your brand’s real visibility in every retailer: banners, category positions, carousels and newsletters. Share of Voice by brand, category and market.
Learn more →Module 03 · Content
Digital Shelf Analytics
Digital shelf analytics: audit titles, images, attributes and A+ content at every retailer, track share of shelf and fix gaps by SKU and market.
Learn more →Module 05 · Stock
Cross-channel availability
Real-time stock of your products in every retailer and market. Out of Stock detection, coverage rate and availability history by SKU.
Learn more →